ESX 3.5 Logfile Retrieval

vLogView is a Windows® based application which manages VMware® ESX Server log files.

The product is designed to be installed on an administrators PC, and provides the ability to store, view and search ESX Server log files from multiple ESX Servers, without requiring individual login, navigation and manual file transfer.

http://xtravirt.com/xd10132

ESX 3.5 Logfile locations

source http://www.vmwarewolf.com

VMWare ESX Server 3.5

  • Vmkernel – /var/log/vmkernel – records activities related to the virtual machines and ESX server.
  • Vmkernel Warnings – /var/log/vmkwarning – records activities with the virtual machines.
  • Vmkernel Summary – /var/log/vmksummary – Used to determine uptime and availability statistics for ESX Server; human-readable summary found in /var/log/vmksummary.txt
  • ESX Server host agent log – /var/log/vmware/hostd.log – Contains information on the agent that manages and configures the ESX Server host and its virtual machines (Search the file date/time stamps to find the log file it is currently outputting to).
  • Service Console – /var/log/messages – Contain all general log messages used to troubleshoot virtual machines on ESX Server.
  • Web Access – /var/log/vmware/webAccess – Records information on Web-based access to ESX Server.
  • Authentication log – /var/log/secure – Contains records of connections that require authentication, such as VMware daemons and actions initiated by the xinetd daemon.
  • VirtualCenter agent – /var/log/vmware/vpx – Contains information on the agent that communicates with VirtualCenter.
  • Virtual Machines – The same directory as the affected virtual machine’s configuration files; named vmware.log – Contain information when a virtual machine crashes or ends abnormally.

Get Daily CPU statistics in your mail

Thanks to the previous post (http://lucd.info/?p=1455) and a little extra scripting, i am able to run a script which will run daily scheduled and email the results to my mailbox.

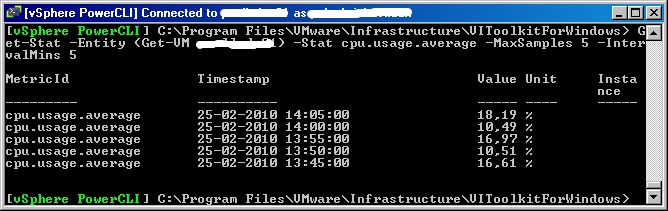
This script will mail a CSV file with all cpu averages in 5 minutes samples between 7.30 and 19:30 off a specific Virtual machine.

If other counters are needed, you can find them in the following document: http://www.vmware.com/support/developer/vc-sdk/visdk25pubs/visdk25programmingguide.pdf

Beneath is the script i’m using (change all bold items):

Add-PSSnapin VMware.VimAutomation.Core

# Mail variables
$enablemail="yes"
$smtpServer = "smtpserver"
$mailfrom = "emailadres"
$mailto = "emailadres1,emailadres2"

# Server Variables
$VIServer = "viserver"
$vmName = "vmname"

# Log File Location
$log = "path\CPU_Stats" + "_" + $VMname+ ".csv"

# Connect to the VI Server
Connect-VIServer $VIServer

# Script
$esxImpl = Get-VM -Name $vmName
$todayMidnight = (Get-Date -Hour 0 -Minute 0 -Second 0).AddMinutes(-1)
$workingDays = "Monday","Tuesday","Wednesday","Thursday","Friday"
$dayStart = New-Object DateTime(1,1,1,7,30,0)     # 07:30 AM
$dayEnd = New-Object DateTime(1,1,1,19,30,0)      # 07:30 PM

$stats = Get-Stat -Entity $esxImpl -Stat cpu.usage.average -Start $todayMidnight.AddDays(-0) -Finish $todayMidnight.AddDays(+1)
$report = $stats | Where-Object {
	$workingDays -contains $_.Timestamp.DayOfWeek -and
	$_.Timestamp.TimeOfDay -gt $dayStart.TimeOfDay -and
	$_.Timestamp.TimeOfDay -lt $dayEnd.TimeOfDay
}

$report | Export-Csv $log -NoTypeInformation

if ($enablemail -match "yes")
{
$msg = new-object Net.Mail.MailMessage
$att = new-object Net.Mail.Attachment($log)
$smtp = new-object Net.Mail.SmtpClient($smtpServer)
$msg.From = $mailfrom
$msg.To.Add($mailto)
$msg.Subject = “CPU Statistics $VMname”
$msg.Body = “Business-hours CPU Statistics are attached   ”
$msg.Attachments.Add($att)
$smtp.Send($msg)
}

$VIServer | Disconnect-VIServer -Confirm:$false

esxcfg-info – VMware ESX Server Info tool

/usr/sbin/esxcfg-info provides a view of the internal state of the VMkernel and Service Console components.  This tool is designed to provide information used in debugging and troubleshooting VMware ESX Servers.

OPTIONS
     -N N    Print info output for N iterations.

     -a –all
             Print all information available through esxcfg-info.

     -w –hardware
             Print hardware information.

     -r –resource
             Print resource and schedule information.

     -s –storage
             Print storage and disk-related information.

     -n –network
             Print console and VMkernel networking information.

     -y –system
             Print ESX Server system software information.

     -o –advopt
             Print the advanced options.

Stats like:

                  \==+Vcpu 0 Times :
                     |----Up Time...................................5948953771096
                     |----Used Time.................................121045150047
                     |----System time...............................757604332
                     |----Run Time..................................120931466689
                     |----Total Wait Time...........................5810226229619
                     |----Ready Time................................17792379668
                     |----Extra Time................................137103851718
                  \==+Vcpu 1 Times :
                     |----Up Time...................................5948953683199
                     |----Used Time.................................86015359219
                     |----System time...............................0
                     |----Run Time..................................86442159816
                     |----Total Wait Time...........................5841800107575
                     |----Ready Time................................20711030428
                     |----Extra Time................................137103851718
                  \==+Affinity Info :
                     |----Constrained...............................false
                     |----Joint.....................................true
                     |----User set..................................false
                     |----HyperThreading............................Any
                  \==+Memory Client Stats :
                     |----Touched...................................102.40 MB
                     |----Current Size..............................2.00 GB
                     |----Target Size...............................1.42 GB
                     |----Balloon Active............................1 KB
                     |----Balloon Size..............................0 KB
                     |----Balloon Target............................0 KB
                     |----Balloon Maximum...........................1.30 GB
                     |----Checkpoint Read...........................0 KB
                     |----Checkpoint Target.........................0 KB
                     |----Shared....................................1.26 GB
                     |----Zero......................................166.54 MB
                     |----Shared Saved..............................797.06 MB
                     |----COW hint..................................711.30 MB
                     |----Userworld Overhead........................47.45 MB
                     |----Overhead..................................116.24 MB
                     |----Overhead Maximum..........................207.61 MB

Installing ESX 4 u1 on a Dell R710 with Intel Quad Port Adapter

We had a new Dell PowerEdge R710 with an additonal Intel Gigabit ET Quad Port Server Adapter network card.

After installing ESX i saw that the intel NIC wasn’t recognized, so i had to install it myself.

What where the steps i performed to install the drivers (after ESX was installed)?

1. Downloaded drivers from the following page: http://downloads.vmware.com/d/details/esx_esxi40_intel_82575_82576_dt/ZHcqYmR0QGpidGR3
2. Extracted the iso to disk
3. Copied the files with WinSCP over to the Dell server
4. Logged in the ESX server as root
5. Placed the ESX server in maintenance mode
6. Run “esxupdate -bundle=INT-intel-ladd-ddk-igb-1.3.19.12.1-offline_bundle-185976.zip update”
7. Issued a “shutdown -r now” command

After the server was rebooted, the nic was recognized and i did a exit maintenance mode.

Get ESX host CPU and Memory stats

Use the following CLI to get the state of your ESX hosts, the cpu and memory usage:

t-Datacenter | Sort | Get-VMHost | Sort | Get-View |`
Select Name, OverallStatus, `
@{N="CPU Usage (GHz)";E={[math]::round(
$_.Summary.QuickStats.OverallCpuUsage/1024,2)}}, `
@{N="Memory Usage (GB)";E={[math]::round(
$_.Summary.QuickStats.OverallMemoryUsage/1024,2)}}

Add line 7 to it to get all status except green:

Get-Datacenter | Sort | Get-VMHost | Sort | Get-View | `
Select Name, OverallStatus, `
@{N="CPU Usage (GHz)";E={[math]::round(
$_.Summary.QuickStats.OverallCpuUsage/1024,2)}}, `
@{N="Memory Usage (GB)";E={[math]::round(
$_.Summary.QuickStats.OverallMemoryUsage/1024,2)}} | `
Where { $_.OverallStatus -ne "green" }

source: http://laez.nl/quick-and-simple-vmware-esx-host-statistics/